
Six Essential Things to Know About the Social Security Program
1) Its official name is the Federal Old-Age and Survivors Insurance and Federal Disability Insurance program. Drop the “Federal” terms and you can see where the acronym often used comes from: OASDI. It operates under Congressional legislation that dates back to 1935. OASI is the acronym for the Social Security insurance program and DI the acronym for the Disability Insurance program.
2) It is a pay-as-you-go program. That means that current year benefits are paid solely out of current year income. This is perhaps the most important feature and least appreciated by the public despite any worker or retiree claiming they have paid into the program for decades and expect to receive the promised benefits.
3) The Social Security Act limits income for annual benefit payments to three sources. First is OASDI taxes paid by employed workers that year. Second is income the Trust Fund assets earned that year. And third is drawing on the Trust Fund assets themselves if the first two sources aren’t sufficient. Any excess of income after payment of benefits in a year are put into the Social Security Trust Fund and invested in U.S. Treasury securities. The “General Fund” (the U.S. government’s operating budget, in other words ordinary annual spending) cannot use Social Security income. Conversely, Social Security receives no income from the General Fund.
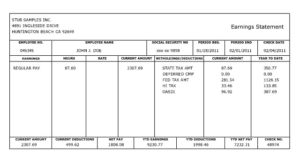
Here is an example of how OASDI taxes on earned income appear on a sample paystub.
According to the program’s history as described on the Social Security Administration website, the one exception regarding program support from the general fund was by Congressional action in 1984. The Reagan administration’s 1983 Social Security Reform study commission, named after its chairman (Fed Chairman Alan Greenspan), was the first to address program short-term and long-term funding issues. The one exception addressed the short-term funding problem. Here’s a key summary section of their report, the Findings and Recommendations, showing the recommendation for rates that are currently in place. Note also that this commission unanimously recommended NOT changing the structure of the program.
The OASDI program’s employment tax rate assessed on earned income (up to a maximum amount of earnings) rose steadily from its initial 1.0% assessed on employers and employees (each) and has remained at a constant rate over the past three decades. (Those links provide detailed history.)
The key implication of these first statements is that Social Security is the law, but there is also no legislated guarantee that there will be sufficient funds to pay benefits in future years. The Trust Fund is a sequestration, not a funded investment vehicle. In fact, it is the ultimate in sequestration in government resources and spending.
4) The sheer numbers of Baby Boomers has been and remains the #1 issue facing the program’s funding in the future. Servicemen returned from WWII and, having seen so much death and destruction, set about establishing homes, households, and families. They and their spouses increased the birthrate from 1946 until 1964, the accepted final year of the Baby Boomer generation. The rate was about 20 births per 1,000 women at the end of the war and rose rapidly to about 25. The birthrate steadily declined below 20 after the Baby Boomers were born to about 12 births per 1,000 women in recent years. Over time, more Baby Boomers receiving Social Security benefits will have fewer workers in the economy earning income on which OASDI taxes are charged. That means that immigrants are the only other source of workers to produce future Social Security income contributions. Immigration has been challenged by politics and is now severely challenged by a global pandemic. The pandemic’s shock to employment is also a blow to Social Security program income.
Here is a table showing the Baby Boomer birthrate bubble. The sources are the United Nations and the U.S. Department of Health and Human Services.
For those who like a more visual presentation, here is a chart illustrating the birthrate bubble.
The Baby Boomers’ entry into the economy built the Social Security Trust Fund. The first column in the next table shows the Trustees Report financial year. The Trust Fund assets at the end of that financial year are in the third column. Their growth rate is calculated in the fourth column.
I wanted to show how the Baby Boomers pumped up the Trust Fund surpluses, causing growth in Trust Fund assets. So I present the birth rate year in the second column, 30 years separated from the financial year, capturing an adult’s full entry into the working world by age 30. The fifth column is the birth rate for that birth rate year. In the last two wide columns, I note milestones in the first Baby Boomers’ and final Baby Boomers’ lives — when they turn 62 and 65 (retirement thresholds).
Those WWII veterans were fruitful and multiplied. Their children started to join the working world a few decades later. The Trust Fund assets rose as their numbers — much greater than the number of retirees in those years — paid OASDI employment taxes each year. And now those same greater numbers are retiring with a smaller workforce in their wake.
BabyBoomersImpactonSocSecTrustFundBalances
The next table shows the Trust Fund growth for the combined programs with notes from the recent Trustees Reports foreshadowing future deficits.
Birth Rate vs Social Security Trust Fund Balance History
5) The Social Security and Disability Insurance programs have been legislated as a combined insurance scheme, but they are operated separately. They had and continue to have different objectives.
Disability is a much smaller program. As it faced insolvency (the lack of resources to pay full “promised” benefits) in the mid-1990s and again in 2016, resources from Social Security were legislatively transferred to shore up Disability. I did a post on the history prior to 2015 and a subsequent one on the Budget Act of 2015, which once again raided Social Security, but in a much smaller, short-term way. The 1995 raid shored up Disability for two decades while moving up the estimate of Social Security insolvency 13 years. The more modest 2015 raid seemingly solved DI insolvency for only a few years. However, the most recent Trustees Reports describe how the Trump administration tightened up administration of the Disability Insurance program, putting it on solid footing for the future, as reviewed before the pandemic hit. As this post and the blog focus on the Social Security program, I’m leaving readers to do their own research on DI. (A link to the Trustees Reports can be found below.)
The key point is that DI is less a threat to Social Security going forward, outside of any impact from the pandemic. Next summer’s Trustees Report will show how much Disability will have been used as a form of unemployment insurance as it was after the financial bubble burst in 2008, if at all.
6) Each year the Trustees of the Social Security Trust Fund are required to send a report on the OASDI program to Congress. The report covers in detail the operations of the two separate insurance programs and their combined view. The U.S. Secretary of the Treasury is the managing Trustee. The Secretary of Labor is another Trustee, along with the head of the Social Security Administration. Two other public Trustee positions have been vacant in recent years.
Most reports are published in the summer, discussing the prior financial year’s performance. For example, the report published this summer (in 2020) covered financial year 2019, which began on October 1, 2018, and ended on September 30, 2019. (In my tables and charts, the columns should be clearly labeled “report year” or “financial year”.)
While the annual report is very long, any ordinary citizen can read the summary, which is short. It shows the income and expenditures of each of the programs, major statistics, and an estimate of when each is expected to run out of sufficient funds to pay full promised benefits. Here are links to:
the 2020 Annual Report of the Board of Trustees of the Federal Old-Age and Survivors Insurance and Federal Disability Insurance Trust Funds (look for the PDF symbol for the PDF version)
and
Social Security History
1935 The Social Security Act
1939 The Social Security Trust Fund (created through legislation)
Various historical angles on the program (a link to the Social Security Administration’s history page)
Notable events, as presented by the Social Security Administration (a link to detailed history)
Social Security Fun Fact
1968 First use of the “Unified Budget” presentation by the Johnson administration, combining the Social Security and other “off-budget” programs with on-budget programs
All Social Security surpluses have been booked solely into the Trust Fund since 1939. Trust Fund assets (these accumulated surpluses) are invested in special U.S. Treasury securities, which earn interest, which remains in the SS program. Social Security benefits can be paid only from current OASDI taxes on earned income, interest earned on Trust Fund Treasury securities, and the Trust Fund assets themselves.
Here is the OMB chart showing the Federal budget’s receipts and outlays over decades. It has the “unified” (combined), on-budget, and off-budget surpluses and deficits. (Click on the link.) I noted key turning points — when the first Baby Boomers (born in 1946) turned 62 (earliest to collect SS), etc. — and the Presidencies. I also filled deficits in red. It’s pretty obvious that it was Social Security that ran the surpluses. They bulged rapidly in the Clinton years. And then began shrinking.
[This useful summary of budget history is from the OMB, the White House’s Office of Management and Budget. The Congressional budget organization is the CBO — the Congressional Budget Office. The numbers are accounting. Both organizations would have the same historical numbers.)